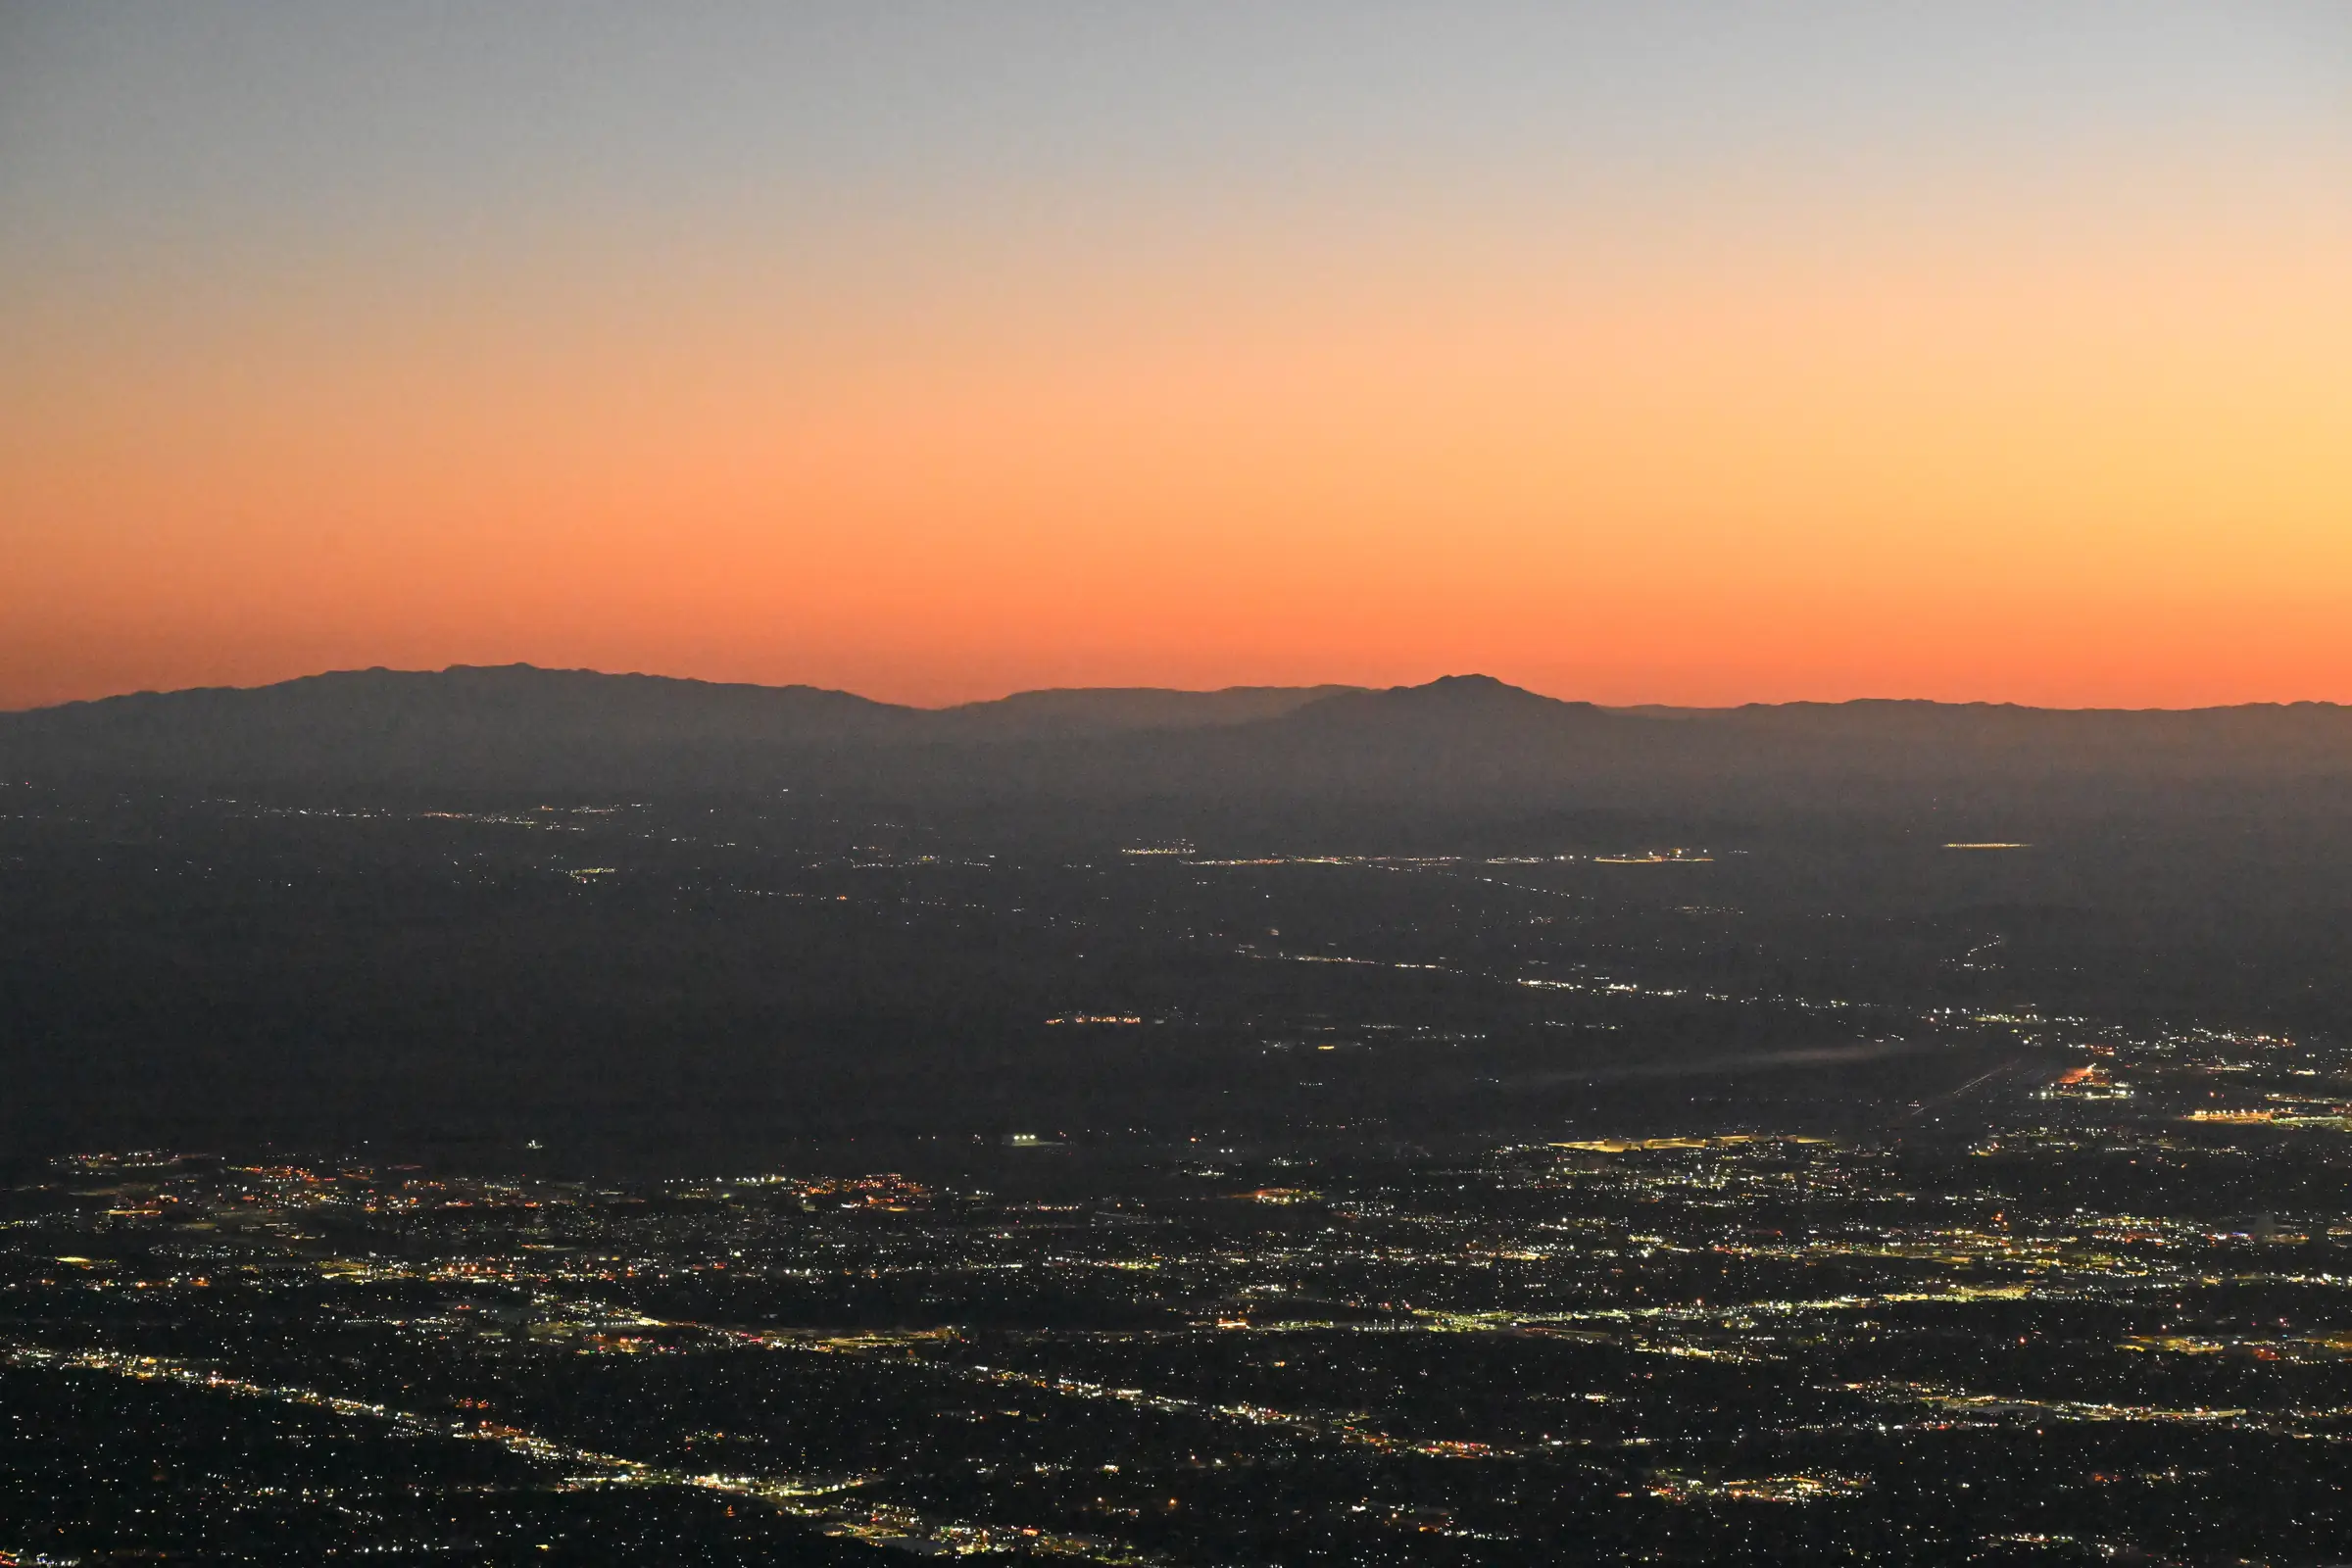
Albuquerque at dusk from Sandia Peak. Photo: G. Edward Johnson, CC BY 4.0

Live Duke City Ledger
Albuquerque, by the numbers
The city as it stands this minute: its weather, its river, its people and the calls it makes, from the public record. The weather, air, river and earthquake figures load live as you read.
- Local time
- --:--
- At the Sunport
- …
- Rio Grande
- …
- Air quality
- …
01
The air
A mile up in the high desert, the air warms fast after sunrise and cools fast after dark. Here is the next day of it.
Right now at the Sunport
--°F
Reading the National Weather Service…
- Feels like
- --
- Today's high
- --
- Today's low
- --
Loading the forecast…
--
--
--
--
- Conditions come from the Weather Service station at the Sunport. It reports whole degrees Celsius, so a reading has to clear a record by more than a degree before this page calls it one.
- Air quality is modeled rather than measured at a station here.
02
The light
The sun comes up over the Sandias and sets behind the volcanoes. Where it is now:
Sunrise
--
Daylight today
--
Sunset
--
03
The river
The Rio Grande runs through the middle of town. The streaks drifting behind this section move faster when more water is flowing, and nearly stop when the river runs dry.
At the USGS Albuquerque gauge
--cubic feet a second
Reading the USGS gauge…
Loading the gauge…
What that much water looks like
--
gallons pass the gauge every second
--
to fill an Olympic swimming pool
--
acre-feet a day: a foot of water spread over that many acres
- The band is the middle half of the daily averages the gauge recorded on each date since 1974. The dashed line is their median.
- The seven-day view reads the gauge every 15 minutes. The longer views use daily averages, and the newest of those are provisional until the USGS checks them.
- A cubic foot holds 7.48 gallons. An Olympic pool holds at least 660,430 gallons. One cubic foot a second for a day is 1.98 acre-feet.
04
The people
The Census Bureau estimates the city has 8,164 fewer residents than in 2020, while the metro area around it grew by 7,587.
Residents, July 1, 2025
The Census Bureau's Vintage 2025 estimate.
Two series. The grey line is the Census Bureau's Vintage 2020 estimates, built from the 2010 Census; the red one is Vintage 2025, built from the 2020 Census. They are drawn apart because the Bureau reset its base between them.
Each square adds up the people in the census blocks inside it. Brighter squares hold more.
Median age
Median household income
Median rent
Median home value
Hispanic or Latino
Below the poverty line
American Community Survey, 2024 1-year estimates. Each figure links to its table.
In 2025 the metro recorded 9,253 deaths and 8,358 births. People moving in made up the difference. Years run July to July. Source: Census Bureau metro estimates.
Hispanic or Latino 47.9% 27.9 points above the U.S.
Children below the poverty line 18.9% 3.4 points above the U.S.
Live below the poverty line 14.7% 2.6 points above the U.S.
Veterans (adults) 7.1% 1.2 points above the U.S.
Median rent $1,227 17% below the U.S.
Average commute 23.1 min 15% below the U.S.
Hold a graduate or professional degree (25+) 16.8% 2.1 points above the U.S.
Median household income $71,494 12% below the U.S.
The eight figures furthest from the national one, by relative gap, from the Census Bureau's ACS 2024 1-year data profiles. Shares under 3% nationally are left out, where a small base exaggerates any gap.
Have no health insurance
Live with a disability
Finished high school (adults 25+)
Hold a bachelor's degree or higher (25+)
Hold a graduate or professional degree (25+)
Median household income
Live below the poverty line
Children below the poverty line
Households that own their home
Median home value
Median rent
Table B01001, folded into nine age bands.
50%
Table B25070: 43,376 of the 87,116 renter households whose share the Bureau could compute. Each square is one in a hundred.
45% of commuters get there in under 20 minutes.
Table B08303, workers who did not work from home.
What Albuquerque does for work
Top: Education, health care and social assistance, 25.4% against 23.8% nationally.
From the Census Bureau's ACS 2024 1-year data profiles, for people who live in the city, wherever they work.
Top: Management, business, science and arts, 46.2% against 43.5% nationally.
From the Census Bureau's ACS 2024 1-year data profiles, for people who live in the city, wherever they work.
- 1 Presbyterian 13,460 ▲ from 4 since 2015
- 2 Sandia National Labs 13,299 ▲ from 3 since 2015
- 3 Albuquerque Public Schools 12,060 ▼ from 2 since 2015
- 4 Veterans Hospital 7,959 new to top ten since 2015
- 5 City of Albuquerque 7,074 ▲ from 7 since 2015
- 6 UNM Hospital 7,003 same rank since 2015
- 7 University of New Mexico 4,641 ▼ from 1 since 2015
- 8 Kirtland Air Force Base (Military) 4,100 ▲ from 9 since 2015
- 9 State of New Mexico 4,030 ▼ from 8 since 2015
- 10 Kirtland Air Force Base (Civilian) 3,700 ▼ from 5 since 2015
From the city's annual financial report for fiscal 2025, page 202, which credits Albuquerque Economic Development and the employers. The report does not say whether counts are full-time or all staff. UNM stopped counting student workers in 2014.
05
The calls
Police were called about 577 times a day in the four weeks to October 21. The quietest hour starts at 6 a.m., the busiest at 5 p.m.
What the calls were about
September 24 to October 21, the latest four full weeks.
- A call is a request for police, not a crime.
- From the city's calls-for-service feed, which the Ledger copies each morning. The city publishes it late, up to about ten days behind, which is why this chapter stops where it does.
- Calls are grouped by the Ledger's dispatch dictionary.
06
The fixes
Weeds, litter, abandoned cars, missed trash pickups: what residents ask the city to fix through 311.
Requests still open, Oct 24
3,197
937 of them, 29%, had been open more than 30 days.
Since you opened this page
0 new requests, at the pace of the last four weeks
731 a day, averaged over Sep 26 to Oct 23.
The most common open requests
Topic names are the city's own.
Or dial 311, or 505-768-2000. For an emergency, call 911.
- The counter is an estimate: the average above, spread evenly across the clock. The record holds 27 of those 28 days.
- From the city's 311 layer, counted by the Ledger each morning.
07
The ground
The valley sits in the Rio Grande Rift, where the continent is slowly pulling apart. The ground still shifts.
Earthquakes in the last 30 days, within 155 miles
--
Reading the USGS catalog…
- Rings mark 50, 100 and 150 miles from downtown. Dot size follows magnitude.
- Basemap © OpenStreetMap contributors, OpenFreeMap.
What this is
The city's dashboard
One place where Albuquerque's public numbers update themselves. The weather, air, river and earthquake figures load in your browser from the agencies that publish them, each time you open the page. The rest come from Census releases and from the city's own records, which the Ledger copies every morning.
The Census tables, the city estimates, the metro estimates and the river statistics above were read when this page was built, on October 25, 2026. The comparison figures were not answering, so they come from the Ledger's last good pull, on September 17, 2026. Everything live says when it was measured.
Sources
- Current conditions at the Sunport (KABQ), National Weather Service
- Hourly forecast for central Albuquerque, National Weather Service
- Sunrise, sunset, UV index and US AQI, Open-Meteo
- Rio Grande at Albuquerque (08330000), USGS
- Daily flow statistics for the same gauge, 1974 to 2026, USGS
- Daily mean flow at the same gauge, the last two years, USGS
- Daily temperature records for the Albuquerque area, NOAA Regional Climate Centers (ACIS)
- Observations at the Sunport since midnight, National Weather Service
- Earthquakes within 250 km, USGS
- Opening photo: Albuquerque at dusk from Sandia Peak, G. Edward Johnson, CC BY 4.0
- City population estimates, Vintage 2025, U.S. Census Bureau
- City population estimates, Vintage 2020, U.S. Census Bureau
- Total Population (B01003), ACS 2024 1-year, U.S. Census Bureau
- Median Age by Sex (B01002), ACS 2024 1-year, U.S. Census Bureau
- Sex by Age (B01001), ACS 2024 1-year, U.S. Census Bureau
- Hispanic or Latino Origin (B03003), ACS 2024 1-year, U.S. Census Bureau
- Median Household Income in the Past 12 Months (In 2024 Inflation-adjusted Dollars) (B19013), ACS 2024 1-year, U.S. Census Bureau
- Median Gross Rent (Dollars) (B25064), ACS 2024 1-year, U.S. Census Bureau
- Median Value (Dollars) (B25077), ACS 2024 1-year, U.S. Census Bureau
- Gross Rent as a Percentage of Household Income in the Past 12 Months (B25070), ACS 2024 1-year, U.S. Census Bureau
- Travel Time to Work (B08303), ACS 2024 1-year, U.S. Census Bureau
- Poverty Status in the Past 12 Months by Sex by Age (B17001), ACS 2024 1-year, U.S. Census Bureau
- Data profiles for Albuquerque, its metro area, New Mexico and the U.S., ACS 2024 1-year data profiles, U.S. Census Bureau
- Metro area population estimates and components of change, Vintage 2025, U.S. Census Bureau
- Principal employers, City of Albuquerque, New Mexico, Annual Comprehensive Financial Report, fiscal year 2025; Statistical Section, Schedule 17: Principal Employers, Current Year and Ten Years Ago, page 202
- 2020 Census block populations, Bernalillo County, U.S. Census Bureau
- APD calls for service, City of Albuquerque, as archived by the Ledger
- 311 service requests, City of Albuquerque, as counted by the Ledger
- ABQ311, City of Albuquerque