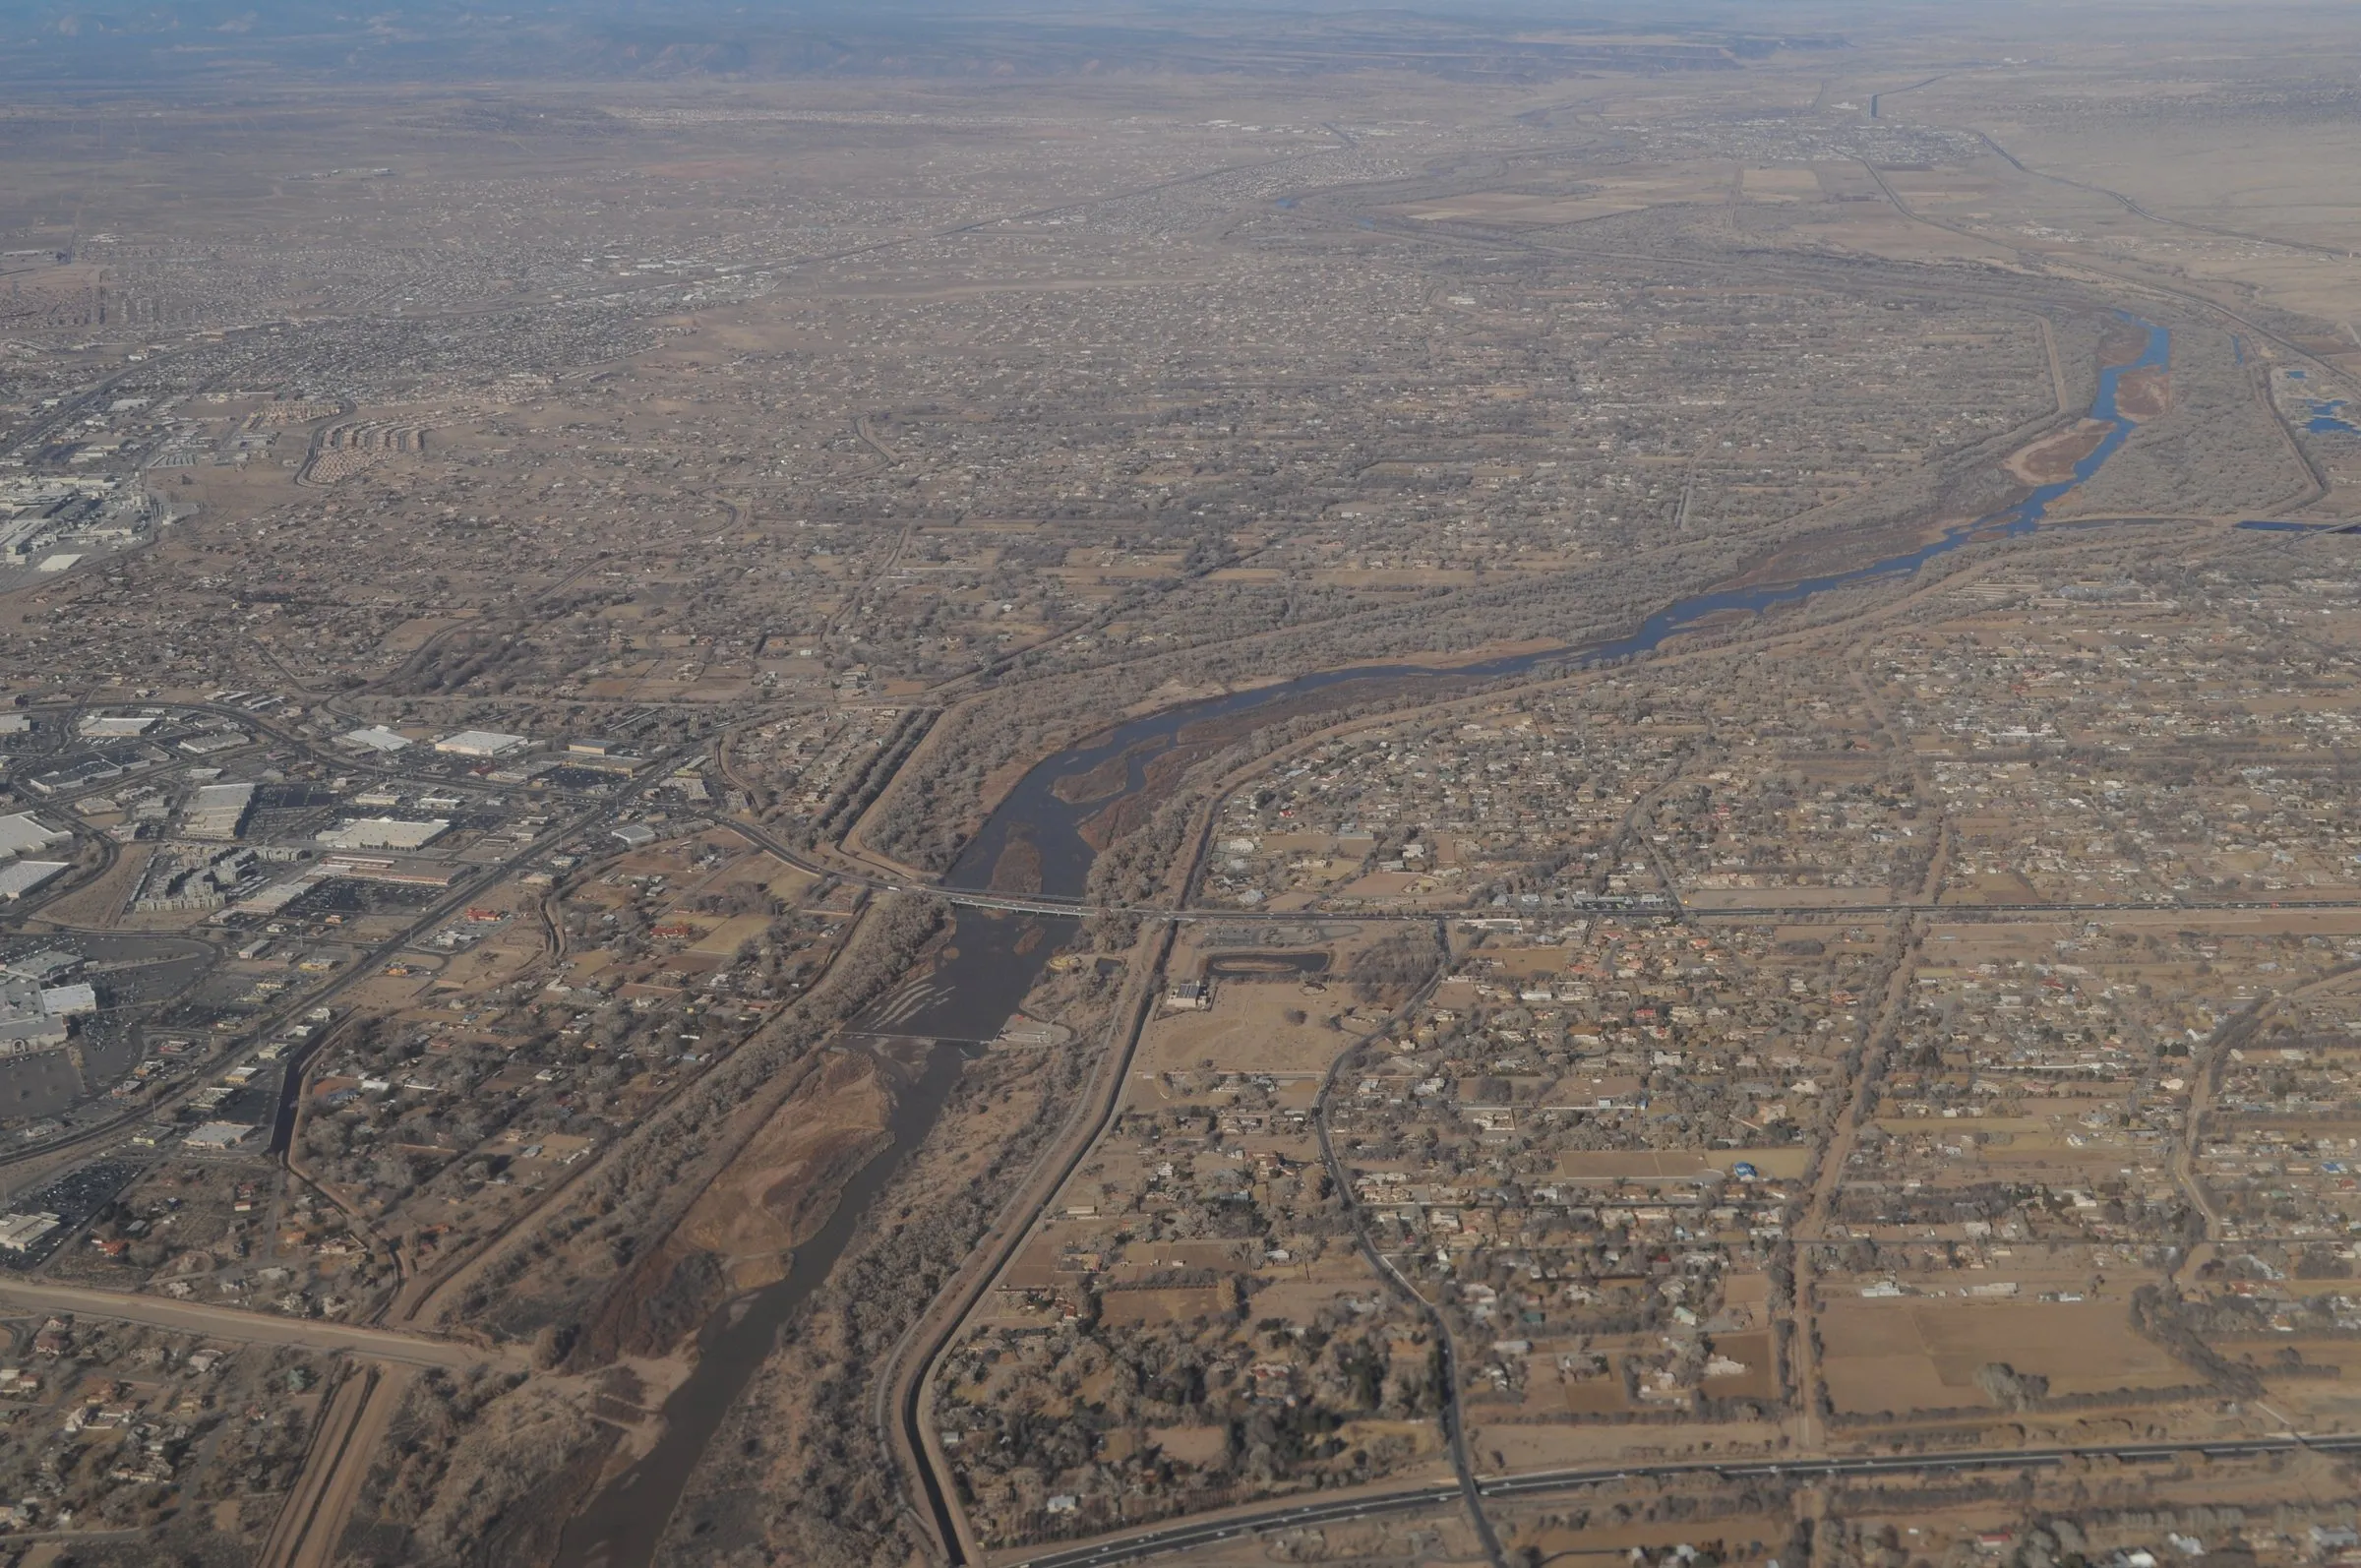
For most of this summer the Rio Grande was a dry sand road through the middle of Albuquerque. The gauge the U.S. Geological Survey keeps on the river at Albuquerque measured no flow at all on 83 days between June 4 and September 12. The gauge has kept a daily record since October 1965. No other year in it has more than 74 days without flow, the count for 1972. Last year had 26.
The Ledger’s new page, Albuquerque by the numbers, follows that gauge as it reads, next to six other chapters of public figures about the city. This story is the guide to it, and the river is where to start.
The river, and what the chart is showing you
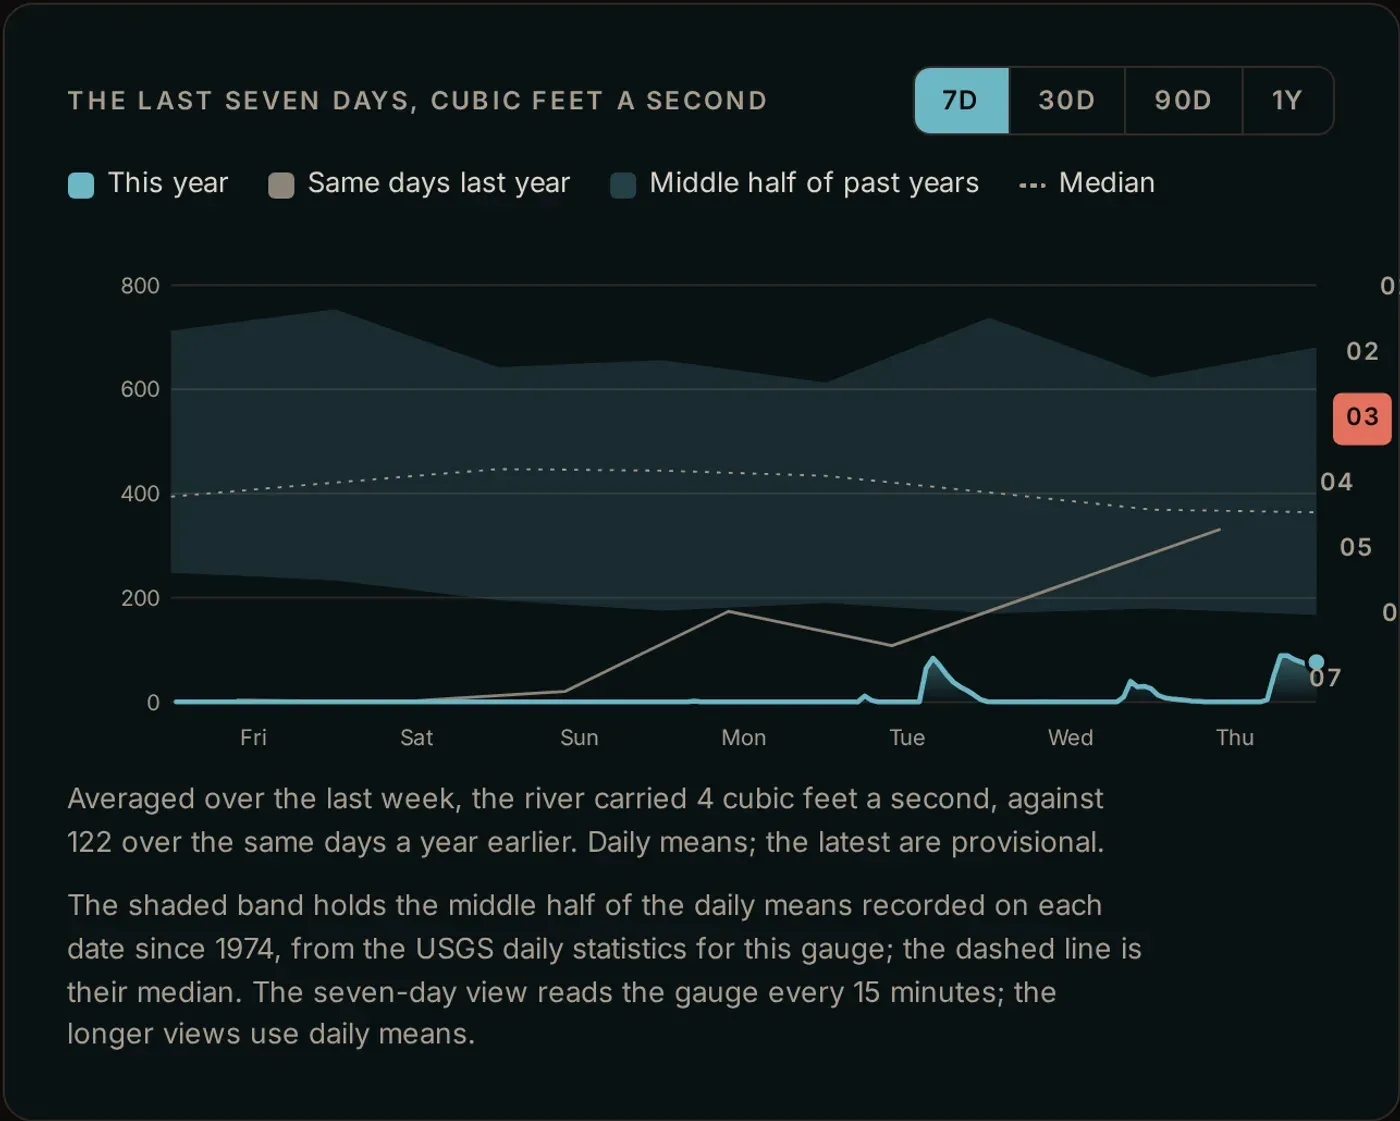
The chart holds three things at once. The line is the flow now. The band behind it is what the river usually carries on these dates, from the USGS statistics for this gauge. The dashed line through the band is the median. The gap between the line and the band is the drought, drawn.
Four buttons change how far back it looks: seven days, 30 days, 90 days and a year. Each view also draws the same days a year earlier, in grey, so a bad year has something to stand against.
Under the chart the flow is put in terms a person can picture. At 100 cubic feet a second, about 748 gallons pass the gauge every second. The river would fill an Olympic swimming pool in about 15 minutes. At zero it fills nothing.
One week this summer broke the run of zeroes. The Albuquerque Bernalillo County Water Utility Authority released about 2,000 acre-feet from Abiquiu Reservoir, roughly 650 million gallons, at the start of that week. Its notice says the water was sent to study how a dry channel takes it, and to help the bosque. “This one-time release will allow us to gather important data about how water flows through the river following a period of extended dryness,” Water Authority board chair Barbara Baca said in the notice. It will also show how the river feeds groundwater and what the water does for plants and trees, she said.
The gauge caught water that week and then lost it. Flow past it averaged 50 cubic feet a second on September 4 and 62.7 on September 5. On September 6 it was 1. From September 7 through September 12 it was zero again.
It has not read zero since September 13. The flow crept up for a few days, then rain brought the river back, KRQE reported on September 18. It was the wettest September at the Sunport since records began in 1891. That day the gauge averaged 965 cubic feet a second. On September 29 it averaged 1,550, almost five times the median for the date. By October 11 it was down to 433, a little above that date’s median of 367.
The dry channel ran through the middle of town. In early August about 13 river miles were dry in the Albuquerque area, stretching roughly from Paseo del Norte to just past the Rio Bravo bridge, Anne Marken of the Middle Rio Grande Conservancy District told KUNM. It was only the third time since the 1980s that the river through Albuquerque had dried, she said, after 2022 and 2025. The gauge agrees. Before 2022, the last year it recorded a day without flow was 1977.
The drying reaches far beyond the city. As of August 30, 112.4 miles of the river between Cochiti and Elephant Butte were dry, Sharon Wirth of the New Mexico Interstate Stream Commission told Source New Mexico. That is the most since at least 2007. Last year’s high was 78.9 miles.
The water was gone before summer. The Bureau of Reclamation said in April that snowpack held 13% of median for the Rio Grande headwaters and 4% for the Rio Chama basin. Heron, El Vado and Elephant Butte were each down to between 11% and 13% of capacity. Drying had already begun at San Acacia on March 27, the earliest on record in three decades, and Reclamation warned then that the river through Albuquerque could dry this summer.
What else is on the page
Seven chapters, in the order they scroll.
- The air. What the Sunport is reading right now, how it feels, today’s forecast high and low, and the next 24 hours as a curve. Beside it sit the record high and low for the date from NOAA’s climate record, which starts in 1891. When a reading breaks one, or comes within a degree, the page says so at the top of the chapter.
- The light. Sunrise, sunset and how much daylight is left, with the sun placed on its arc over a drawing of the Sandia crest.
- The river. Above.
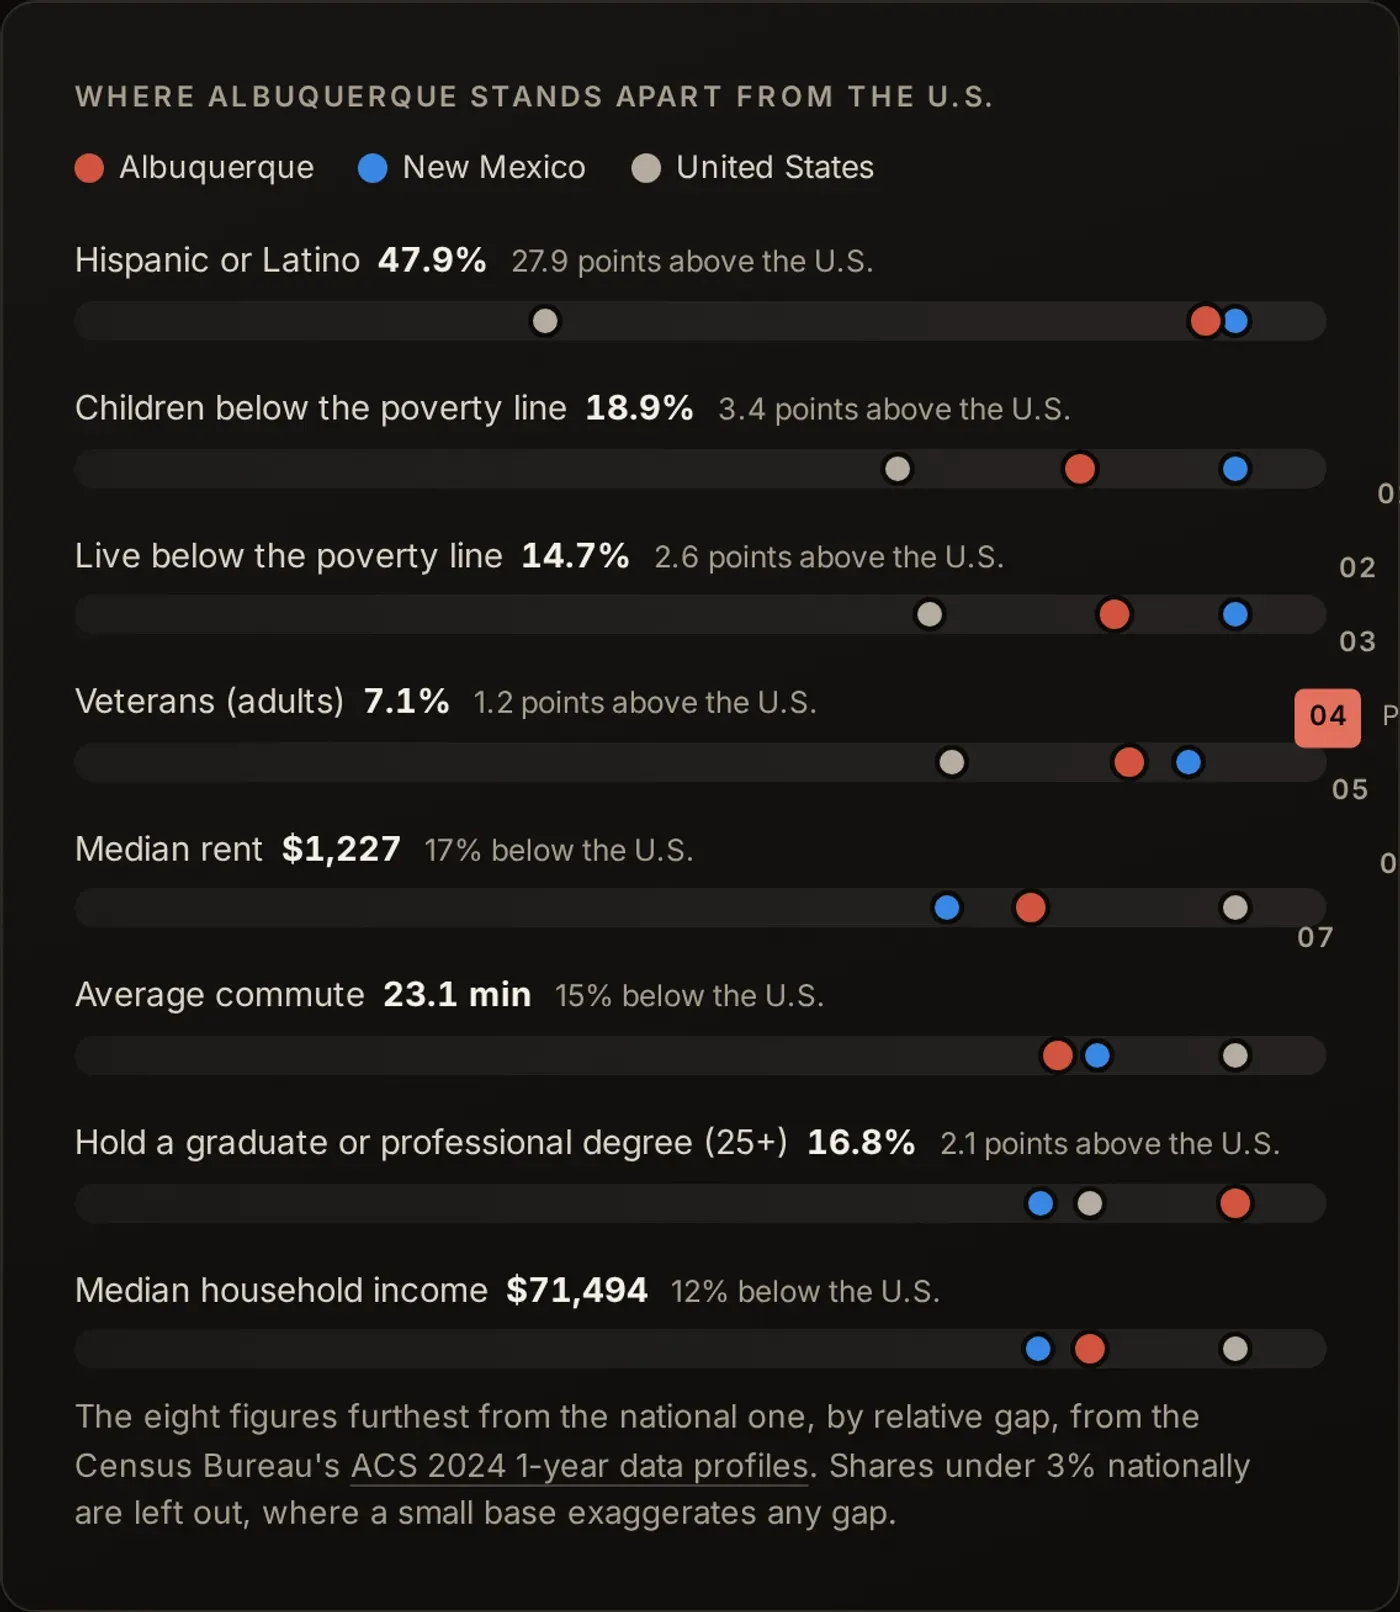
- The people. The city’s population, the metro area’s, and the births, deaths and moves behind each year’s change in the metro. The Census Bureau estimates Albuquerque has 8,164 fewer residents than in 2020 while the metro has 7,587 more. The chapter also shows where the city sits against New Mexico and the country on health coverage, schooling, poverty, rent and work, and lists the metro’s largest employers from the city’s own annual financial report.
- The calls. Police calls by hour of the day and by hour of the week, from the city’s calls-for-service record, which the Ledger copies every morning. That feed runs up to about ten days behind, so this chapter is the latest four full weeks rather than today.
- The fixes. How many 311 requests are open, how long they have been open, what they are about, and how many are opened and closed each week. There is a button to report something yourself.
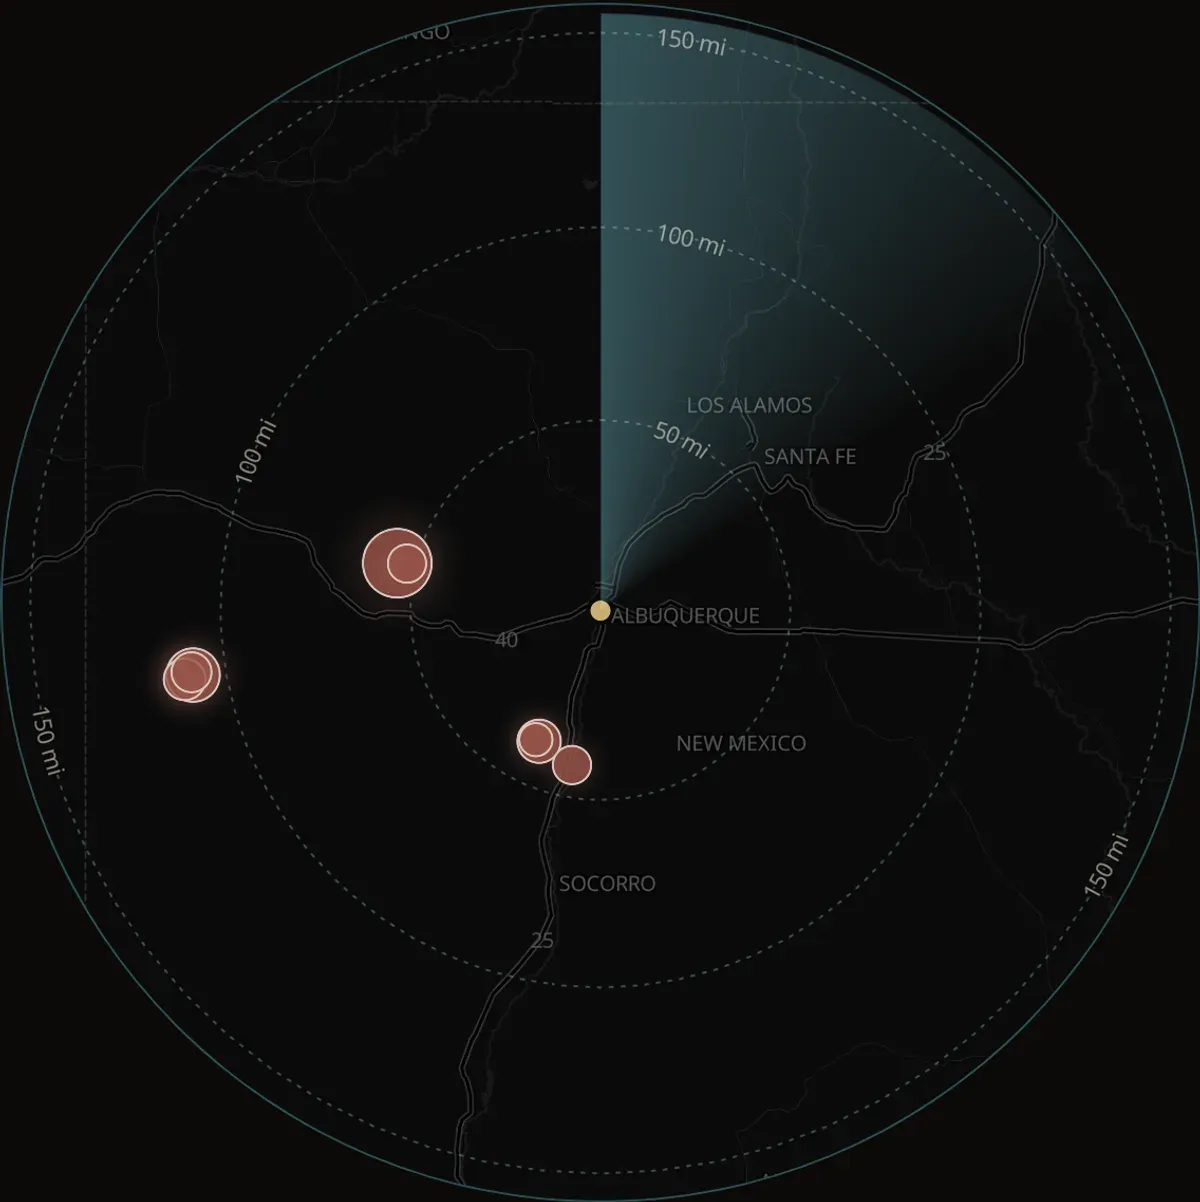
- The ground. Every earthquake the USGS logged within 155 miles in the last 30 days, on a map with a radar sweep over it.
What is live, and what is not
The weather, the air quality, the sun, the river and the earthquakes are fetched while you read, straight from the National Weather Service, Open-Meteo and the USGS. Reload the page and they change.
The rest is as fresh as its source allows, and the page says which. The Census figures come from two Bureau products, the newest of each: the population estimates for July 1, 2025, and the 2024 one-year American Community Survey. The police calls come from a city feed that lags up to about ten days. The 311 counts are taken each morning.
Nothing on the page is filled in with a guess when a source goes quiet. When the USGS does not answer, the river and earthquake figures show the last good reading and say when it was pulled. When the weather service or the climate record does not answer, its figure is left blank with a note saying so. The figures read when the page is built, such as the Census tables, fall back to the last copy the Ledger pulled. A plausible number in place of a missing one is worse than a gap.
Where the numbers come from
Every figure on the page links to the record it came from: a USGS gauge, a Census table, a city feed, a page of the city’s annual financial report. The sources are listed again at the foot of the page with the date each was pulled.
Readings marked provisional are exactly that. The USGS publishes river data before it has checked it, and every one of this summer’s figures carries that mark, so the count of dry days may move when the record is finalized. It would have to move by ten days to put 1972 back on top.
If a chapter is wrong, or a number reads oddly, write to the editor. The page is new, and the figures are only as good as the records under them.
Notes
- The count of dry days is the gauge’s, not a survey of the channel. A day counts when the gauge’s daily average was zero.
- Nobody has confirmed that the water the gauge caught on September 4 and 5 was the Abiquiu release rather than rain.
- This summer’s river figures are provisional until the USGS checks them. The Ledger’s count runs to October 11.
- The band on the chart is drawn from the USGS daily statistics for this gauge, which begin in 1974. The daily record itself runs from October 1965.
- The dry-mile counts come from the River Eyes monitoring program, through the Interstate Stream Commission.
- Anne Marken is the conservancy district’s water operations division manager. Sharon Wirth is the commission’s Middle Rio Grande bureau chief.


Reader comments
What do you think?
Burqueños know this city best. Add what you've seen, ask a question, or push back on the story.
Loading comments…
New here? Sign up with your email. Confirm it and you're in, no password.
Comments are closed on this story.
Comments are the commenter's own words, not the Ledger's. Comment rules