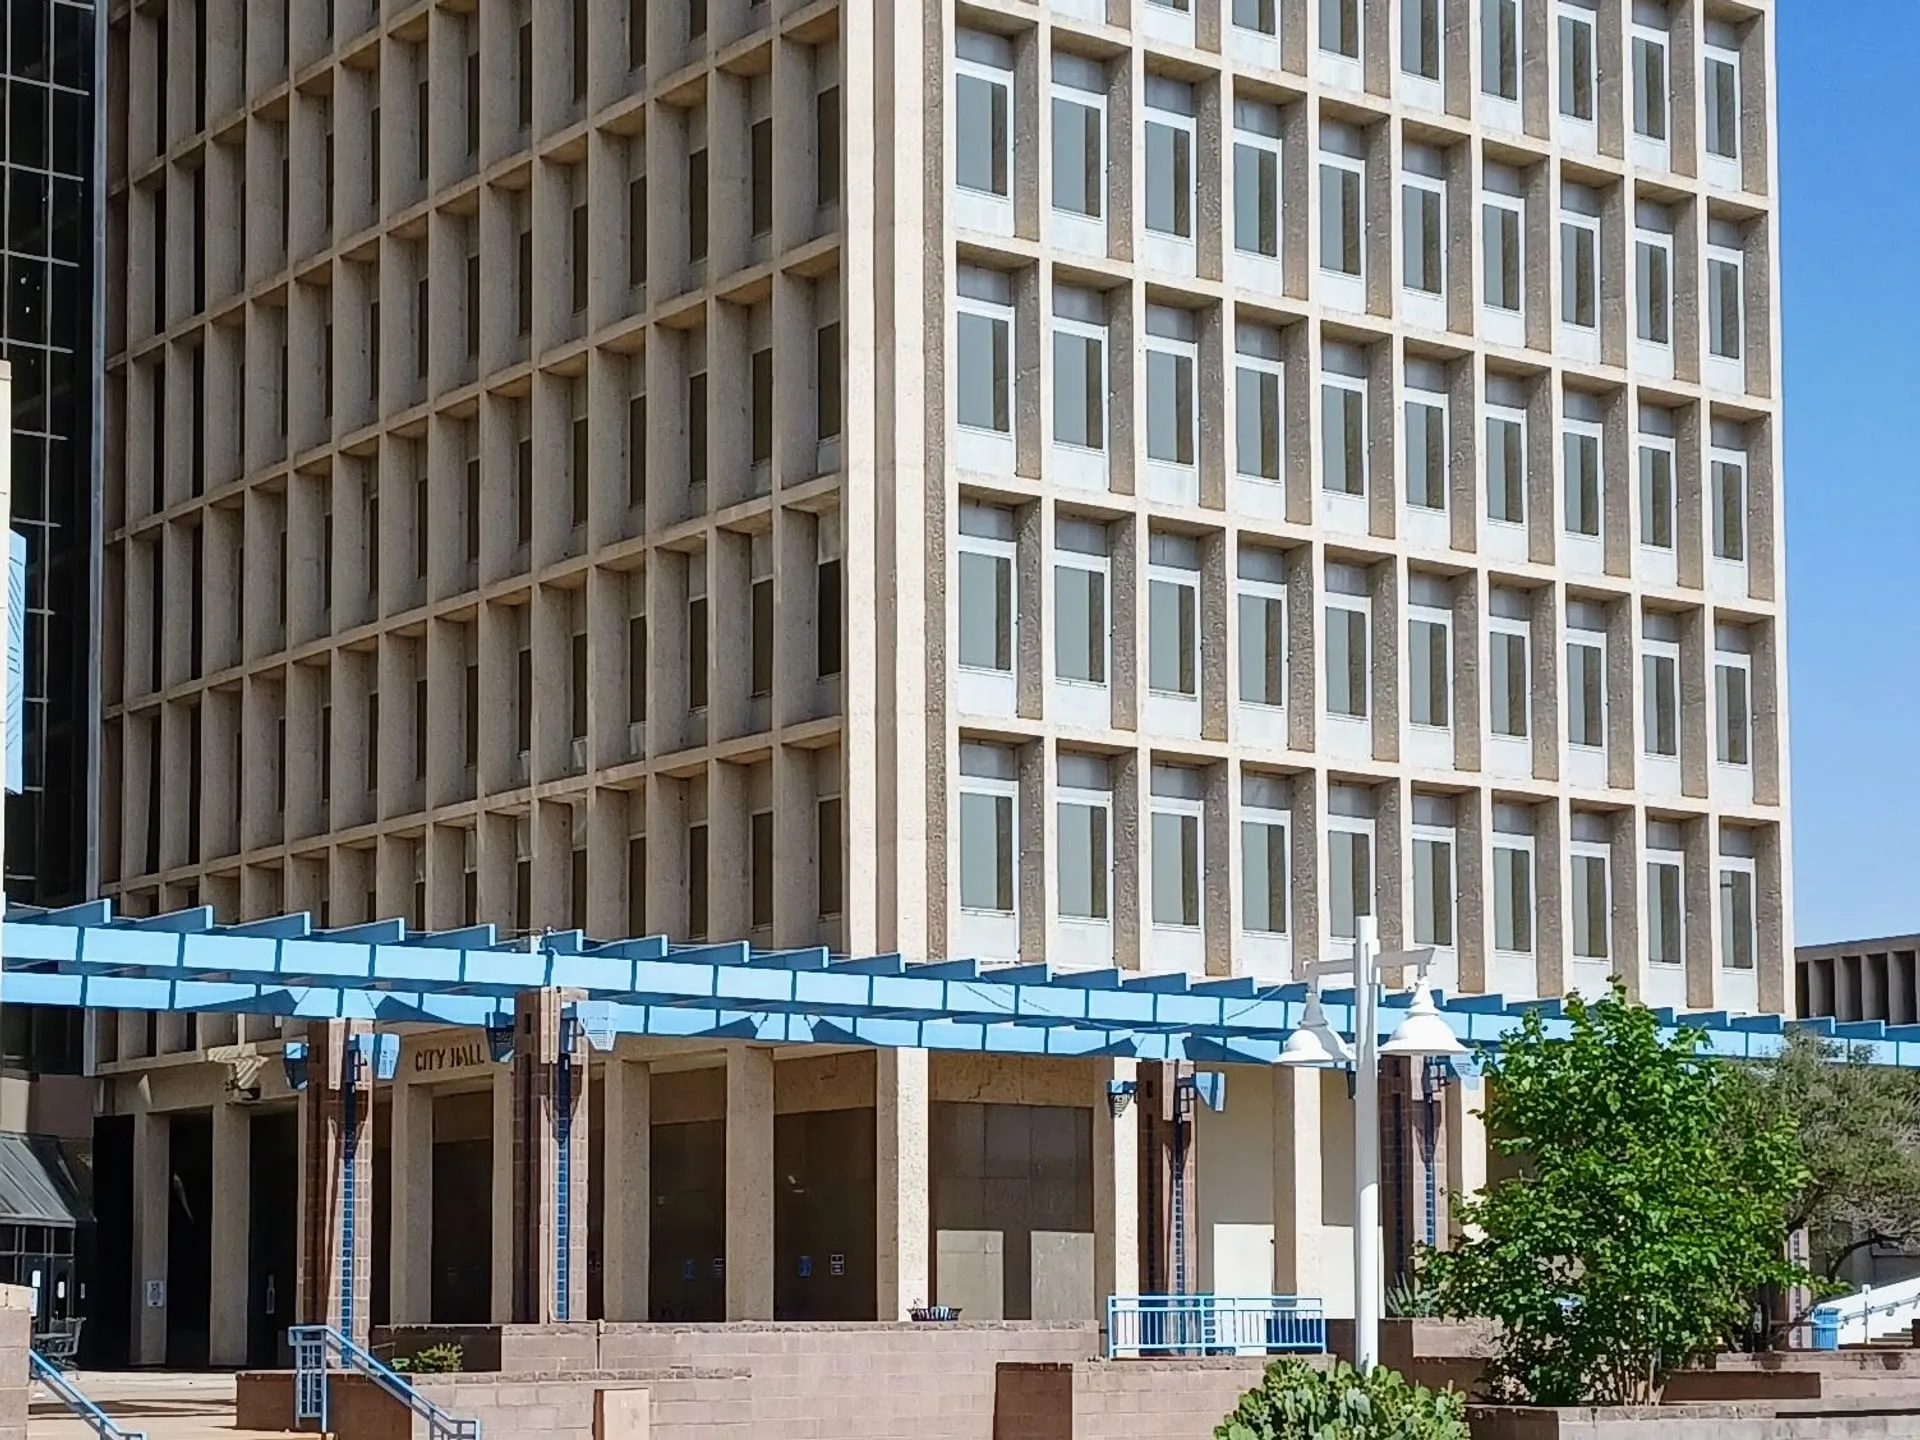
At a KOB-TV debate last November, Tim Keller said crime in Albuquerque was going down. Darren White, the former Bernalillo County sheriff running against him, said “nobody believes that”. Four weeks later Keller won re-election.
Keller had the direction right. Car thefts fell 43 percent that year, and homicides dropped to 65, the fewest since 2016.
He also presided over the worst year for killings the city has on record, 121 in 2022. Keller, a Democrat, had been mayor since 2017 and still is.
The nation’s worst car theft rate arrived under a Republican. In 2016 and again in 2017 the Albuquerque metro had the highest vehicle theft rate in the country. The mayor was Richard Berry, a Republican who held the office from 2009 to 2017.
The record does not sort by party
The car theft crown was not one man’s. The metro had the country’s worst rate in 2016 and 2017 under Berry, and again in 2018, Keller’s first full year in office. Bakersfield took the title the year after.
Vehicle thefts APD reported to the FBI each year, divided by the FBI's population figure for the area APD polices. Shading marks each mayor's years in office. 1997 is the highest year in the series, which starts in 1990. APD moved to the FBI's incident-based system in 2018 and the department says the FBI converts those reports back to the older format so the series stays comparable. Pulled from the FBI Crime Data Explorer on 15 September 2026 and archived at research/data/mayor-party-crime-effect/. Source: FBI Crime Data Explorer, agency NM0010100.
Show the numbers
| Year | Thefts per 100,000 residents |
|---|---|
| 1990 | 513 |
| 1991 | 628 |
| 1992 | 723 |
| 1993 | 878 |
| 1994 | 1,211 |
| 1995 | 1,190 |
| 1996 | 1,638 |
| 1997 | 1,798 |
| 1998 | 1,501 |
| 1999 | 1,117 |
| 2000 | 969 |
| 2001 | 923 |
| 2002 | 885 |
| 2003 | 872 |
| 2004 | 803 |
| 2005 | 774 |
| 2006 | 1,101 |
| 2007 | 982 |
| 2008 | 886 |
| 2009 | 641 |
| 2010 | 508 |
| 2011 | 511 |
| 2012 | 495 |
| 2013 | 538 |
| 2014 | 637 |
| 2015 | 925 |
| 2016 | 1,373 |
| 2017 | 1,369 |
| 2018 | 1,187 |
| 2019 | 971 |
| 2020 | 882 |
| 2021 | 897 |
| 2022 | 1,055 |
| 2023 | 1,034 |
| 2024 | 1,024 |
| 2025 | 583 |
Homicide did not follow the same path. The yearly rate averaged about 8 for every 100,000 residents in Berry’s years and about 17 in Keller’s, on the FBI’s count, which includes justifiable killings that APD leaves out of its own. Even after last year’s drop it was near 13, still above Berry’s average.
One study looked at 3,254 elections and could not find a party effect
Four researchers published a paper in Science Advances last year that went looking for exactly this. They took 3,254 mayoral elections in 398 cities from 1990 to 2021 and tested them three ways, including a method that compares cities where the race was close enough to be near a coin flip.
Their finding: electing a Democrat rather than a Republican “leads to no detectable impact on police staffing or expenditures on criminal justice, nor does it lead to changes in crime or arrest rates.”
The study does not prove a mayor’s party changes nothing. It says any effect is too small for thirty-one years of elections to see.
The same drop is showing up across the country
The Council on Criminal Justice tracks large American cities that publish monthly figures. In the ones reporting it, the average homicide rate in the first half of this year was 18 percent below the same months of 2025 and 51 percent below the first half of 2022.
Albuquerque dropped too, and over the same stretch of the year: through September 15 it has counted 44 homicides against 51 at the same point last year. Its 65 for all of 2025 were the fewest since 2016, when it recorded 61.
By mid-2024 APD was closing more homicide cases than it opened
In 2020 APD made arrests in about 55 percent of its homicide cases. The department then doubled its homicide detective unit, built a three-week detective academy and hired an investigator out of the district attorney’s office to build cases prosecutors could use. Keller’s administration dedicated about $40 million to improving the real-time crime center.
By July 2024 the clearance rate for that year was running at 126 percent. A department cannot solve more killings than it has, so the figure means what it sounds like: detectives were closing that year’s cases and going back for ones from previous years.
A mayor answers to a council, a state, a budget and a union contract
The researchers have an explanation for the blank they found. It is the office itself.
A mayor answers to a city council below and a state government above, and what any of them can change is bounded by budget restrictions and civil service rules. The researchers name police unions as the other limit. Their power grew through the last decades of the twentieth century, and it narrows what a mayor can change about how a department works.
What is left to a mayor is narrower than a campaign makes it sound, and the researchers put it in choices that vary within a party as much as between them: which chief to hire, and what that chief is required to train officers to do. Whether even those choices move crime, the researchers say, their data cannot test.
Reader comments
What do you think?
Burqueños know this city best. Add what you've seen, ask a question, or push back on the story.
Loading comments…
New here? Sign up with your email. Confirm it and you're in, no password.
Comments are closed on this story.
Comments are the commenter's own words, not the Ledger's. Comment rules