The Ledger’s weekly movers page takes one week of calls to Albuquerque police, Monday to Sunday, and compares each kind of call and each neighborhood with its own weekly average for the four weeks before. The calls come from the city’s calls-for-service record.
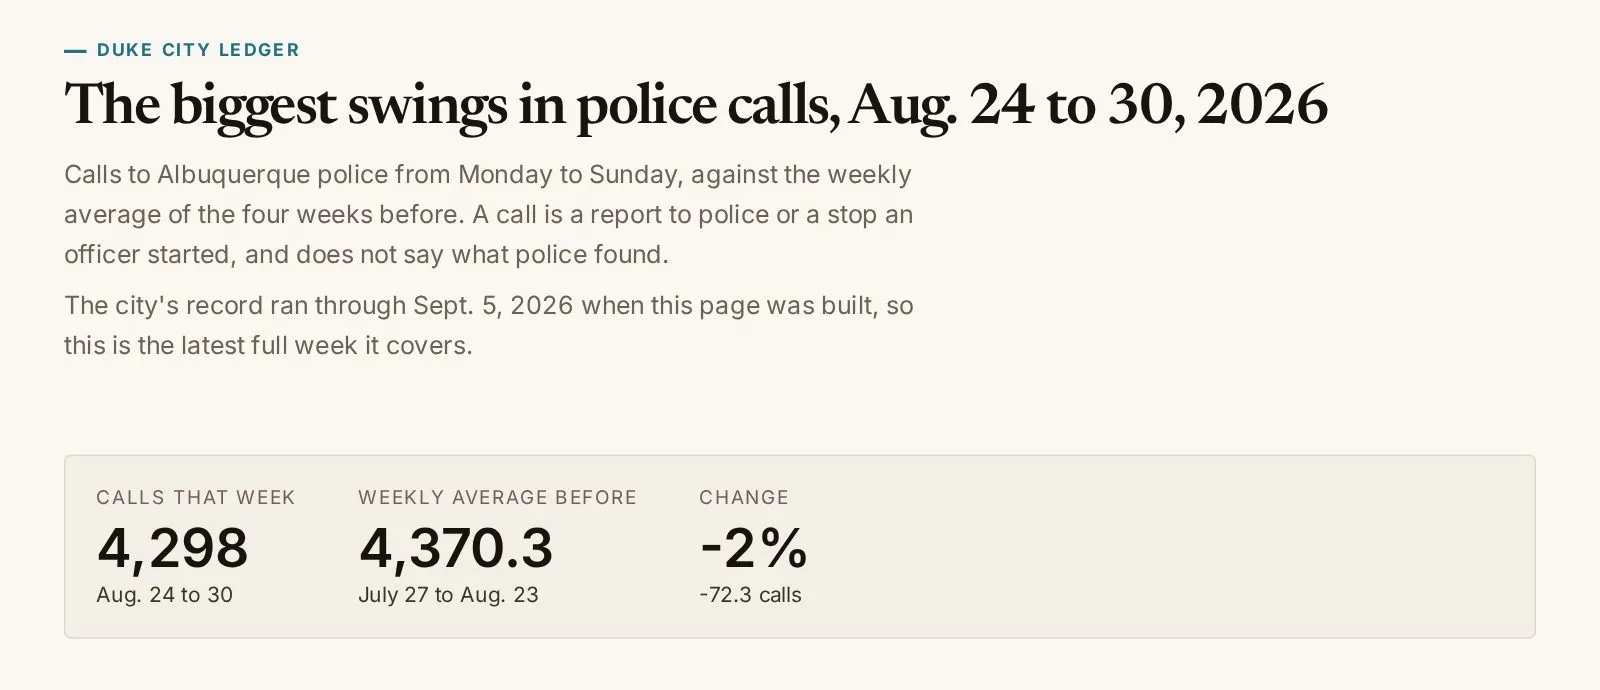
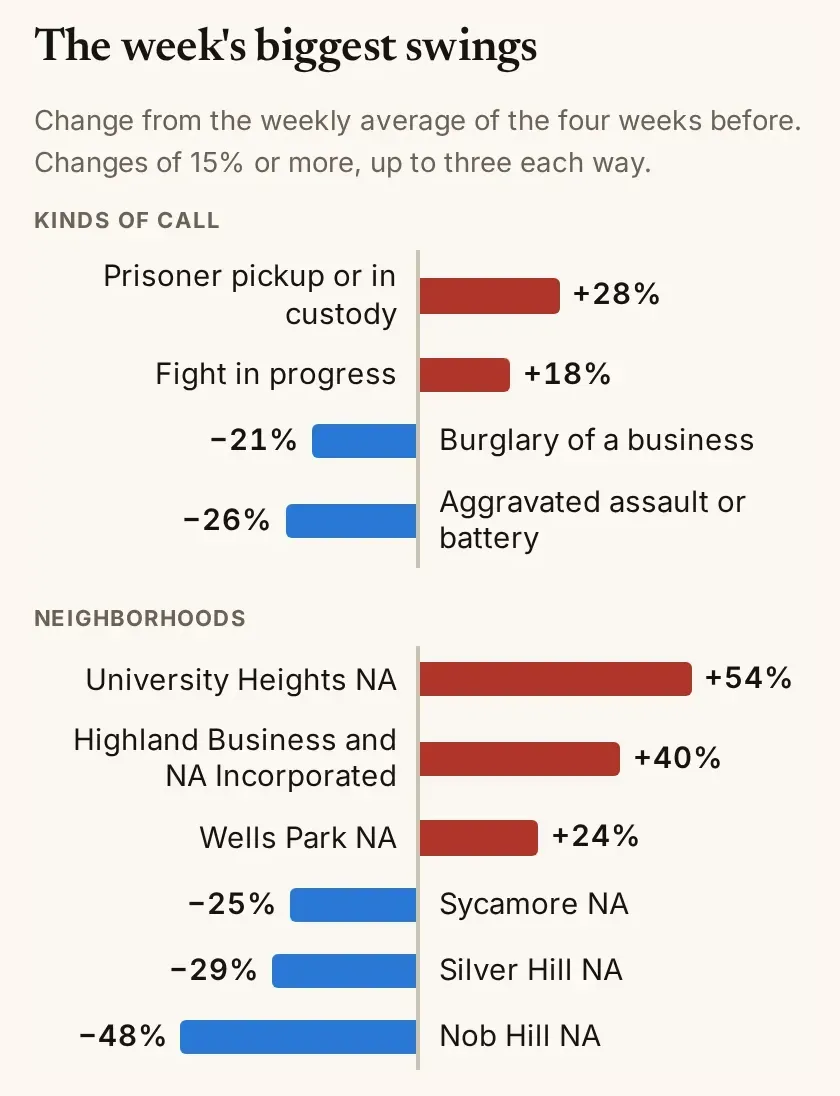
In the week of Aug. 24, the latest the page could show when the Ledger built it on Sept. 17, calls in the Nob Hill neighborhood association fell 48%, and calls in University Heights rose 54%. Citywide, calls were down 2%.
1. The top of the page gives the week and the citywide change
- The heading names the week. Weeks run Monday to Sunday, Albuquerque time.
- Three numbers sit under it: the calls that week, the weekly average of the four weeks before, and the change.
- For the week of Aug. 24 to 30, the page counted 4,298 calls against an average of 4,370.3, down 2%.
2. The chart shows the week’s biggest swings
- Red bars are rises and blue bars are falls, each labeled with its percent change from the four-week average.
- Kinds of call use the city’s dispatch descriptions, written out in plain words. Neighborhoods are the city’s neighborhood associations.
- Only changes of 15% or more count, and the chart shows at most three rises and three falls in each group. In the week of Aug. 24, neighbor trouble calls rose 13%, so they appear only in the tables.
- If nothing in a group moved that far, the page says so in place of its bars.
3. Small counts are left out on purpose
A percent on a few calls jumps around. Three calls against one would read as a 200% rise.
- A kind of call must average at least 15 calls a week in the four weeks before to be ranked. A neighborhood must average at least 25.
- Nob Hill clears that bar. It averaged 42 calls a week before and had 22 in the week of Aug. 24.
- Anything under its floor is left out of the chart and the tables, however far it moved. Its calls still count in the citywide figures.
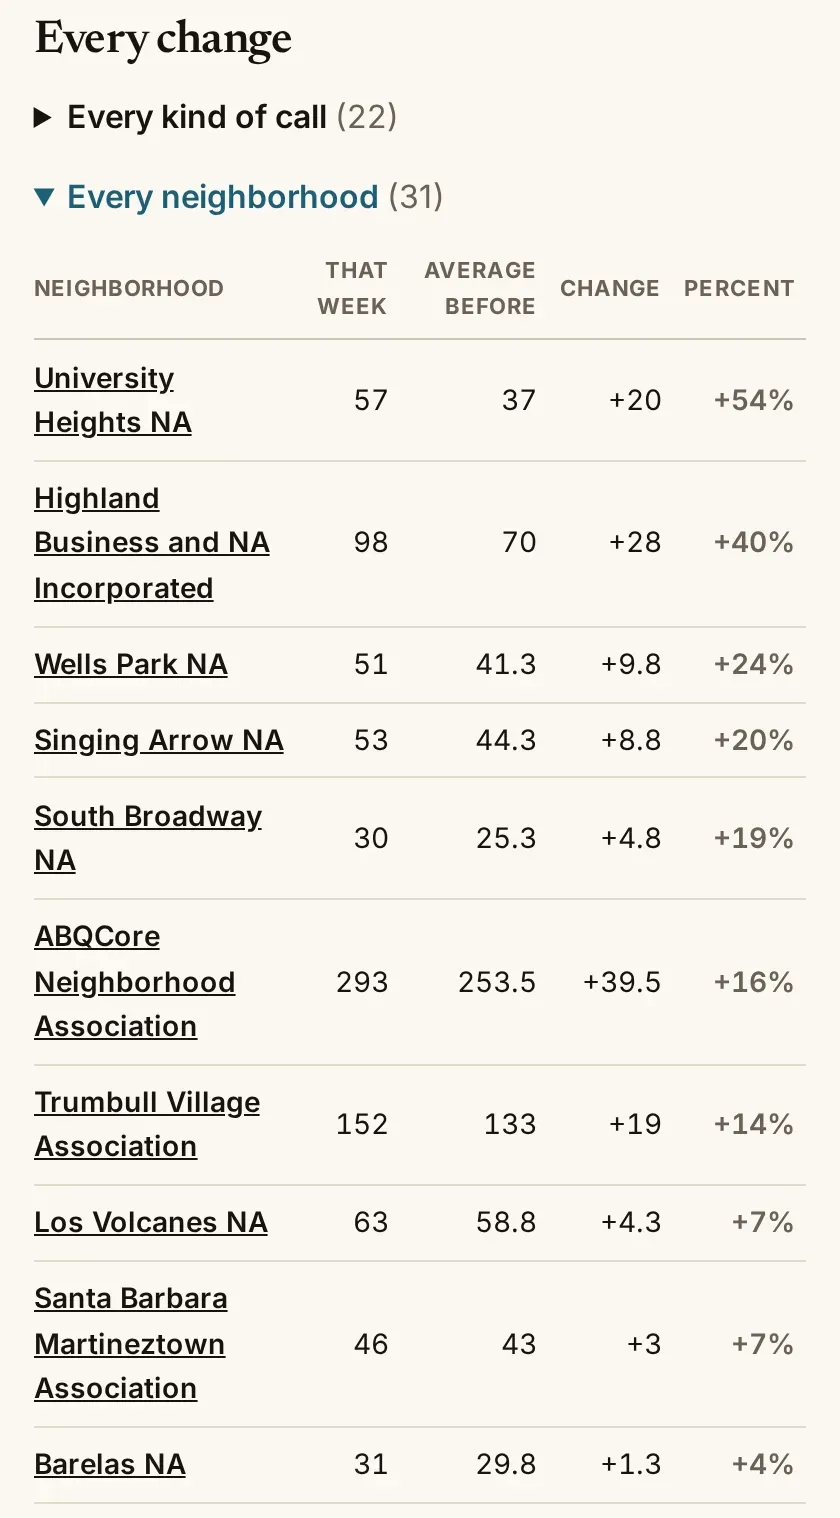
4. Every ranked change is in the tables
- Under Every change, open Every kind of call or Every neighborhood. Each row gives the calls that week, the average before, the change and the percent, from the largest rise to the largest fall.
- Averages can end in a decimal, because four weeks of calls are divided by four.
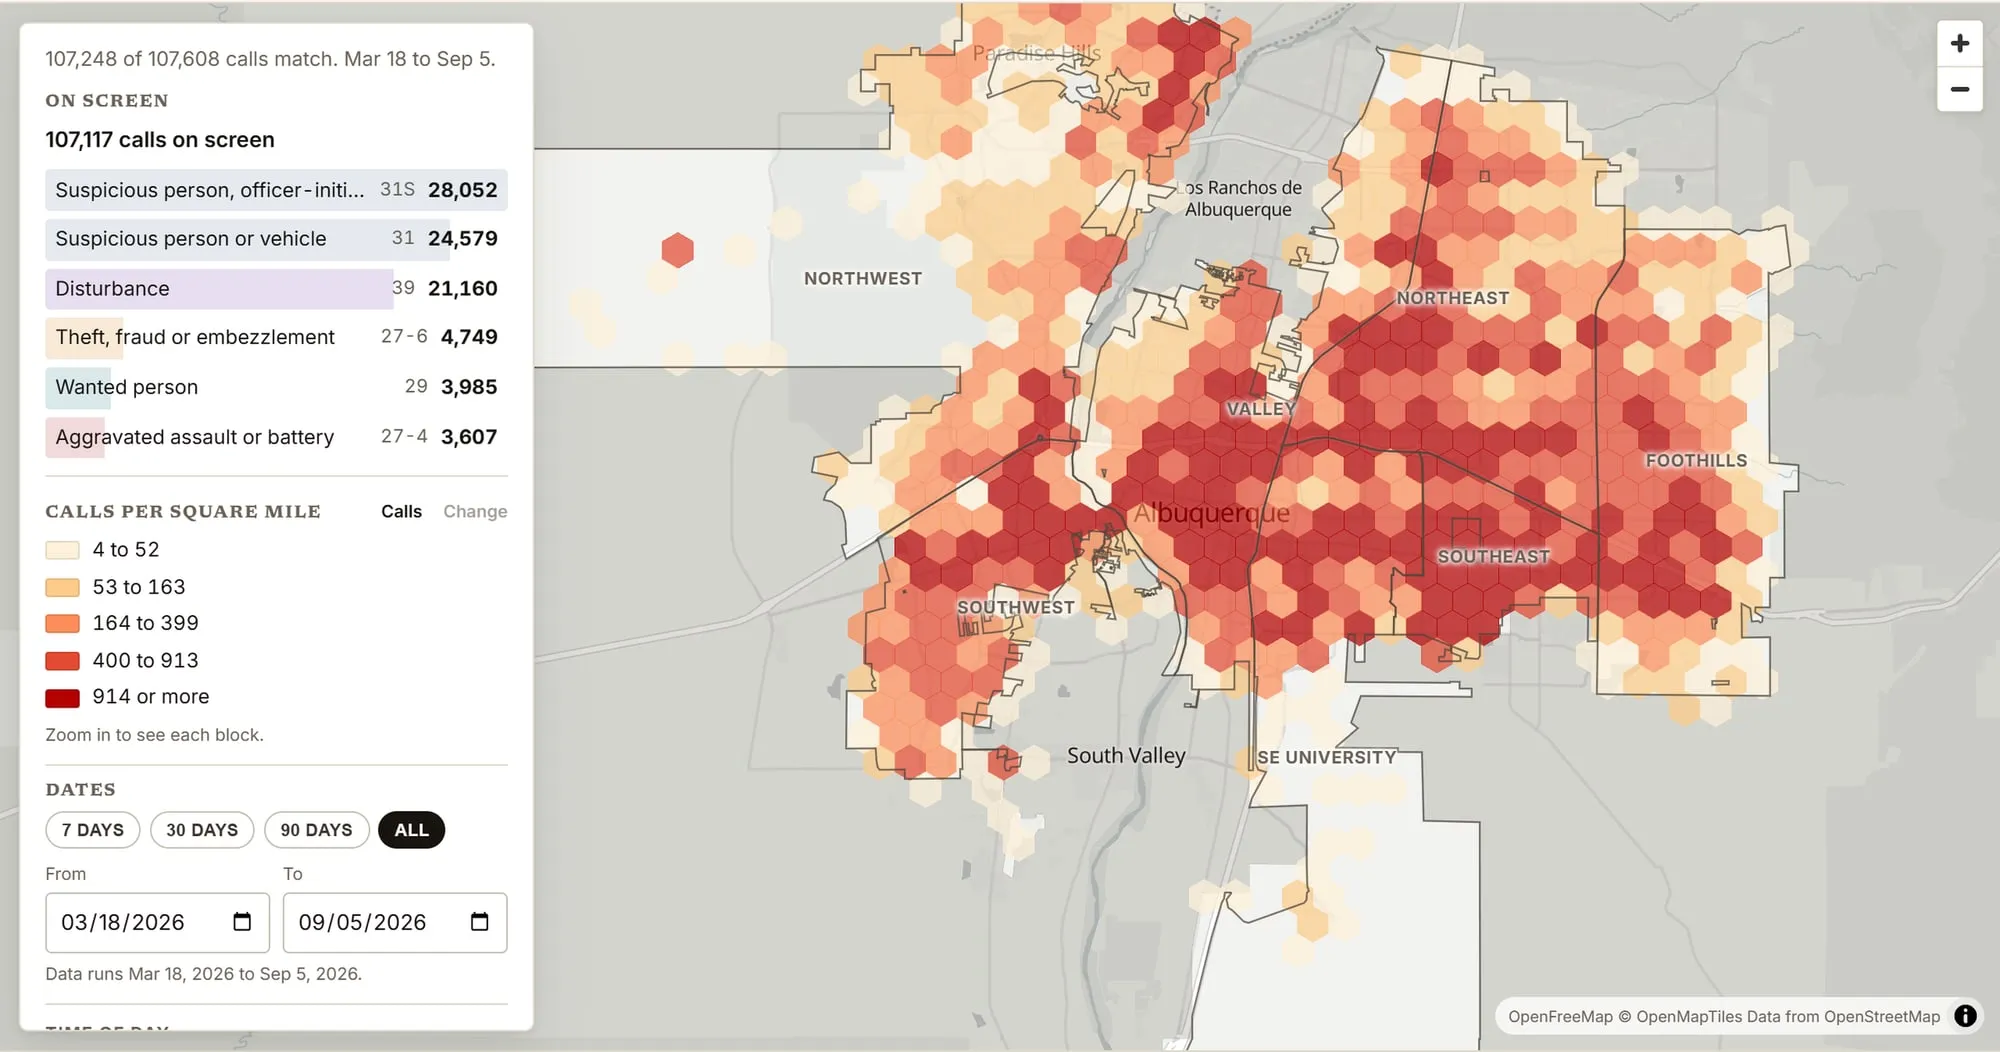
- Tap a name to open the police call rankings for that week, counted by neighborhood. A kind of call opens with only that call picked. The rankings page takes any dates you choose.
A call is a report, not a crime
- A call is a report to police or a stop an officer started. The city’s record gives each call a time, a kind and a block. It doesn’t say what police found or whether anyone was arrested.
- Calls with no location are left out, as on the rankings page.
- The associations cover only part of the city, and some overlap. A call inside two counts in both. A call outside all of them still counts citywide and by kind of call.
The week shown isn’t last week
- The city publishes its calls late. On Sept. 17, the newest call in its record was from the evening of Sept. 6. The page counted through Sept. 5, the last full day.
- The page shows the latest week the record covers in full, and says how far the record ran. When the Ledger built the page on Sept. 17, that was the week of Aug. 24.
- A day with no calls at all is treated as a gap in the record. The page then shows an earlier week and names the empty days.
The swings will also go to Instagram and Facebook
The Ledger will post the biggest swings on Instagram and Facebook, one week at a time, with a pointer back to the page for every change.
Know why calls rose or fell in your neighborhood? Send a tip.
Reader comments
What do you think?
Burqueños know this city best. Add what you've seen, ask a question, or push back on the story.
Loading comments…
New here? Sign up with your email. Confirm it and you're in, no password.
Comments are closed on this story.
Comments are the commenter's own words, not the Ledger's. Comment rules